Complete Guide: Setting Up Analytics with Lynxbe
Complete Guide: Setting Up Analytics with Lynxbe
Analytics is a central tool for any business looking to analyze and improve its performance. The Lynxbe analytics module offers an advanced business intelligence platform that allows business owners to gain practical insights into revenue, usage, and growth. In the digital age we live in, understanding data is the power that drives business owners' decisions. With analytics, one can get a clear picture of what works and what doesn't, enabling real-time improvements.
Israeli business owners, especially in small and medium enterprises, can greatly benefit from working with the Lynxbe analytics module. With accurate insights into revenue and market trends, businesses can understand their customers' needs and tailor their products and services accordingly. This can enhance customer satisfaction and improve financial results.
Prerequisites
Before starting the setup of the analytics module in Lynxbe, make sure you have all the prerequisites. First of all, an active account with Lynxbe is required. If you do not have an account yet, you need to register on the Lynxbe website and create a new account.
Additionally, ensure that you have the appropriate permissions to access the analytics module. Typically, system administrators or account owners are the ones who have the required permissions. If you are working in a team, make sure that your team also has the necessary permissions to access the data you wish to analyze.
Step-by-Step Setup Guide
Step 1: Log into the Lynxbe System
To get started, log into your account on Lynxbe. After logging in, look for the analytics module in the main menu. This is a basic yet crucial step, as you need to ensure you are in the correct system.
Step 2: Access the Analytics Module
In the module menu, click on "Analytics." If this is your first time using the module, you may encounter a screen explaining the various features of the system. It is advisable to go through this information to understand the potential of the module.
Step 3: Setting Up Dashboards
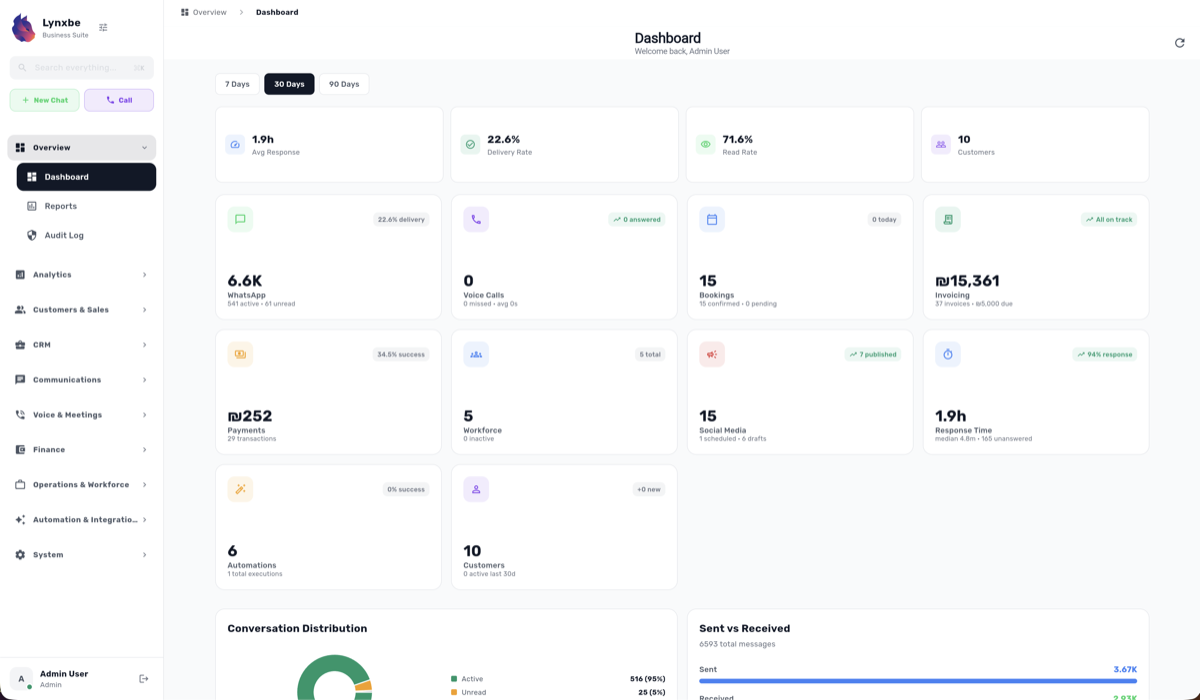
In the analytics dashboard, you can create custom dashboards. Click on the "Create Dashboard" button and then select the data you wish to display. You can choose between dashboards that show revenue, usage trends, and custom reports.
Step 4: Data Analysis and Report Generation
After you have entered the desired data into the dashboard, you can begin analyzing the information. Click on the "Generate Report" button to obtain detailed reports on your business's performance. These reports can include data on revenue, deal closure trends, and more.
Step 5: Analyzing Growth Trends
Now, after you have prepared reports, you can move on to analyzing growth trends. This is a very important step, where you can see which areas your business is growing in and which areas need improvement. These insights can guide you in making business decisions.
Step 6: Sharing Information with the Team
After you have finished analyzing the data, it is important to share the information with your team. You can export the reports as PDF or Excel files and send them via email. Sharing information with the team will help everyone understand the current state of the business and act accordingly.
Step 7: Setting Up Alerts for Significant Changes
As part of the module setup, you can set up alerts that will update you when there are significant changes in the data. This can include a sharp increase in revenue or a decrease in sales. This way, you can stay informed about what is happening in your business in real-time.
Step 8: Using Data for Future Planning
Finally, it is important to use the data you have generated for future planning. Consider the insights you have gained and think about new strategies that can improve your business's performance. Proper future planning can guide you to success.
Best Practices for Setup
When it comes to setting up the analytics module, there are several best practices that can enhance your setup. First, invest time in gaining a deep understanding of the data you are collecting. This includes revenue, customer interactions, and any additional information that may interest you. The more you understand the data, the more insights you can derive from it.
Secondly, it is advisable to update your data regularly. The more up-to-date the information is, the more accurate your analyses will be. Additionally, it is good to set up different dashboards for different areas of the business, so you can easily track various data points.
Industry Applications
Restaurants
In the restaurant world, the Lynxbe analytics module can help analyze sales trends, understand which dishes are more popular, and conduct customer satisfaction analysis. With this data, restaurants can improve their menus and tailor their services to meet customer needs.
Clinics
In clinics, analytics can be used to track the number of patients, understand the workload in the business, and analyze patient satisfaction. Combining medical data with sales data can enhance the medical services offered.
Real Estate
In the real estate sector, the information obtained from the analytics module can help understand market trends, allowing property owners to make informed investment decisions. This way, one can identify the hot areas in the market and which properties may be more profitable.
Retail
In retail stores, analytics can help track daily sales, identify popular products, and analyze customer behavior. This can guide store owners in preparing more effective sales strategies.
Professional Services
In businesses offering professional services, such as accountants and lawyers, analytics can be used to analyze the demand for services, understand the profitability of each service, and improve the internal processes of the business.
Troubleshooting
When working with the analytics module, you may encounter some common issues. One of them is a lack of understanding of the displayed data. If you are unable to comprehend the information, it is advisable to check the settings and consult with the Lynxbe support team.
Another common issue is a lack of data updates. If you do not see changes in the data, make sure the system is updated and that you are collecting the correct data. In such cases, it is a good idea to check if your settings are correct.



Comments
💬 Share your thoughts